Power analysis for GWAS
On this page
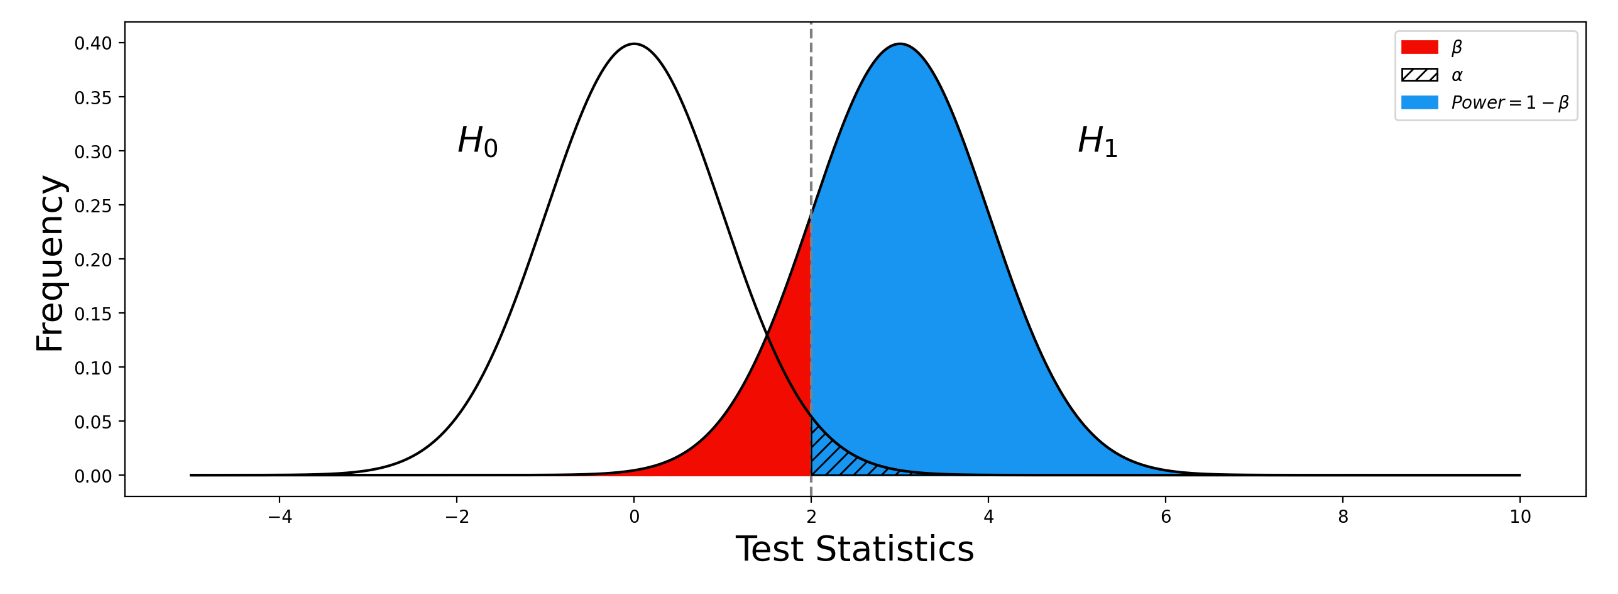
Type I, type II errors and Statistical power
This table shows the relationship between the null hypothesis \(H_0\) and the results of a statistical test (whether or not to reject the null hypothesis \(H_0\) ).
| H0 is True | H0 is False | |
|---|---|---|
| Do Not Reject | True negative : \(1 - \alpha\) | Type II error (false negative) : \(\beta\) |
| Reject | Type I error (false positive) : \(\alpha\) | True positive : \(1 - \beta\) |
\(\alpha\) : significance level
By definition, the statistical power of a test refers to the probability that the test will correctly reject the null hypothesis, namely the True positive rate in the table above.
\(Power = Pr ( Reject\ | H_0\ is\ False) = 1 - \beta\)
Power
Factors affecting power
- Total sample size
- Case and control ratio
- Effect size of the variant
- Risk allele frequency
- Significance threshold
Non-centrality parameter
NCP describes the degree of difference between the alternative hypothesis \(H_1\) and the null hypothesis \(H_0\) values.
Consider a simple linear regression model:
The variance of the error term:
Usually, the phenotypic variance that a single SNP could explain is very limited, so we can approximate \(\sigma^2\) by:
Under Hardy-Weinberg equilibrium, we can get:
- \(f\) : the allele frequency for this variant
So the Non-centrality parameter(NCP) \(\lambda\) for \(\chi^2\) distribution with degree of freedom 1:
Power for quantitative traits
Significance threshold: \(C = CDF_{\chi^2}^{-1}(1 - \alpha,df=1)\)
- \(CDF_{\chi^2}^{-1}(x)\) : is the inverse of the cumulative distribution function for \(\chi^2\) distribution.
where \(X \sim \chi^2(df=1, ncp=\lambda)\) is the test statistic under the alternative hypothesis.
- \(CDF_{\chi^2}(x, ncp= \lambda)\) : is the cumulative distribution function for non-central \(\chi^2\) distribution with non-centrality parameter \(\lambda\).
Power for large-scale case-control genome-wide association studies
Denote :
- \(P_{case}\) : Risk allele frequency in cases
- \(N_{case}\) : Number of cases. The total allele count for cases is then \(2N_{case}\).
- \(P_{control}\) : Risk allele frequency in controls
- \(N_{control}\) : Number of control. The total allele count for control is then \(2N_{control}\).
Null hypothesis : \(P_{case} = P_{control}\)
To test whether one proportion \(P_{case}\) equals the other proportion \(P_{control}\), the test statistic is:
Significance threshold: \(C = \Phi^{-1}(1 - \alpha / 2 )\)
Under the alternative hypothesis, the test statistic \(Z\) follows a normal distribution with mean \(\mu = \frac{P_{case} - P_{control}}{\sqrt{ \frac{P_{case}(1 - P_{case})}{2N_{case}} + \frac{P_{control}(1 - P_{control})}{2N_{control}} }}\) and variance 1.
GAS power calculator
GAS power calculator implemented this method, and you can easily calculate the power using their website

References
- Skol, A. D., Scott, L. J., Abecasis, G. R., & Boehnke, M. (2006). Joint analysis is more efficient than replication-based analysis for two-stage genome-wide association studies. Nature genetics, 38(2), 209-213.
- Johnson, J. L., & Abecasis, G. R. (2017). GAS Power Calculator: web-based power calculator for genetic association studies. BioRxiv, 164343.
- Sham, P. C., & Purcell, S. M. (2014). Statistical power and significance testing in large-scale genetic studies. Nature Reviews Genetics, 15(5), 335-346.