LD score regression
On this page
Introduction
LDSC is one of the most commonly used command-line tools to estimate inflation, heritability, genetic correlation and cell/tissue type specificity from GWAS summary statistics.
LD: Linkage disequilibrium
Linkage disequilibrium (LD) : non-random association of alleles at different loci in a given population. (Wiki)
LD score
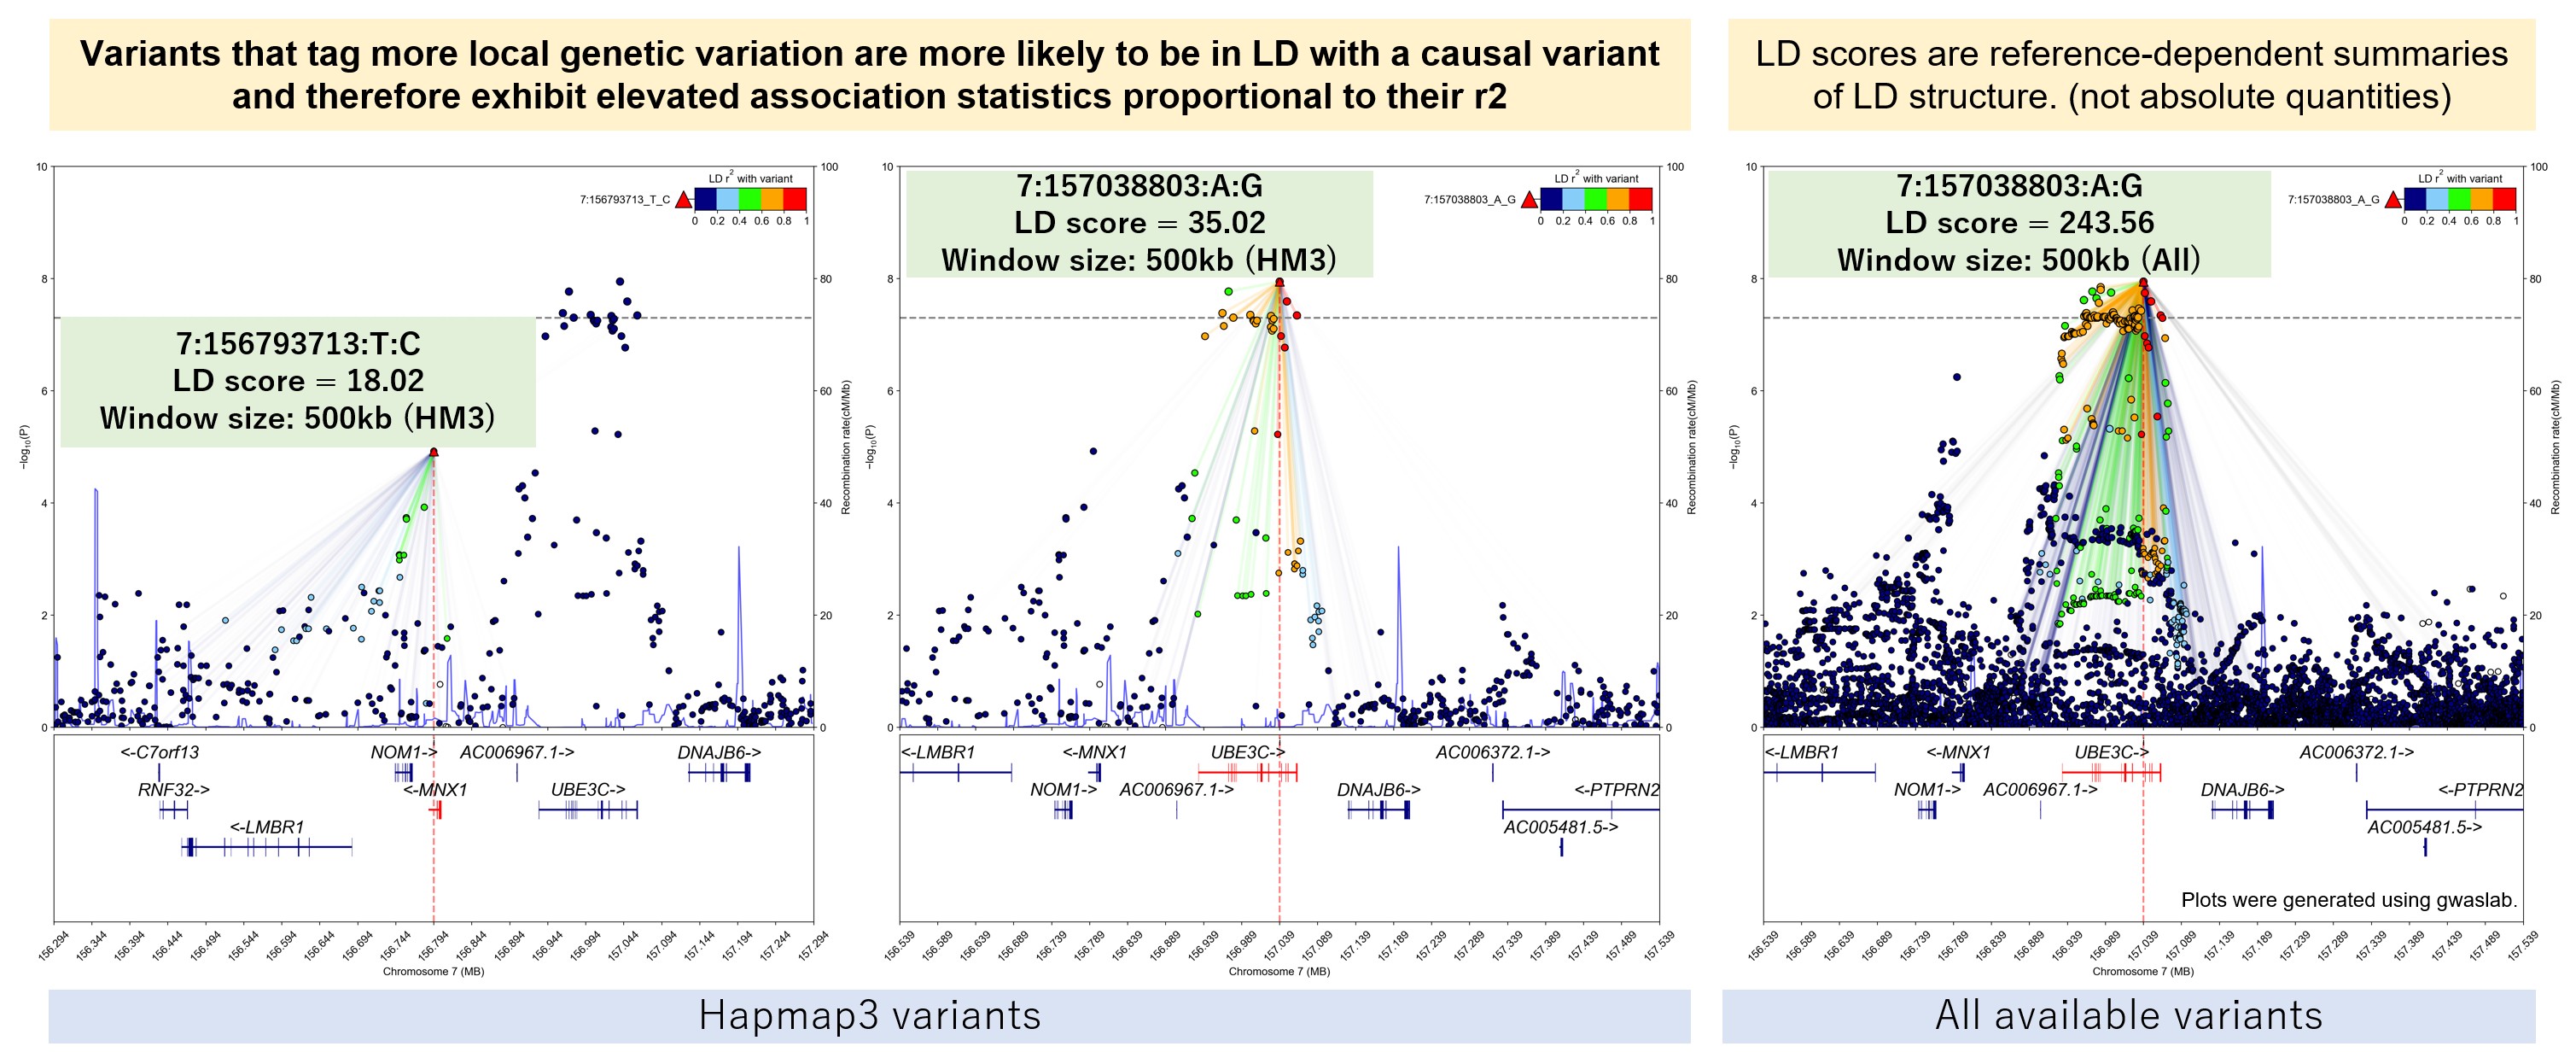
LD score \(l_j\) for a SNP \(j\) is defined as the sum of \(r^2\) for the SNP and other SNPs in a region.
LD score regression
Key idea: A variant will have higher test statistics if it is in LD with causal variant, and the elevation is proportional to the correlation ( \(r^2\) ) with the causal variant.
- \(N\): sample size.
- \(M\) : number of SNPs.
- \(h^2\) : observed-scale heritability
- \(a\) : the effect of confounding factors, including cryptic relatedness and population stratification.
For more details of LD score regression, please refer to : - Bulik-Sullivan, Brendan K., et al. "LD Score regression distinguishes confounding from polygenicity in genome-wide association studies." Nature genetics 47.3 (2015): 291-295.
Preparation
Required data and tools
- Environment: LDSC — Python 2 conda env (Install LDSC); Miniconda if needed.
- Reference: LDSC resources — EAS weights and partitioned scores on Zenodo; EAS genome-wide LD scores via Google Cloud (
gsutil) for some tutorials. - Data: GWAS summary statistics — BBJ HDL-C / LDL-C examples (Munge sumstats).
Install LDSC
LDSC can be downloaded from github (GPL-3.0 license): https://github.com/bulik/ldsc
For ldsc, we need Anaconda to create virtual environment (for python2). If you haven't installed Anaconda, please check how to install anaconda.
# change to your directory for tools
cd ~/tools

# clone the ldsc github repository
git clone https://github.com/bulik/ldsc.git

# create a virtual environment for ldsc (python2)
cd ldsc
conda env create --file environment.yml

# activate ldsc environment
conda activate ldsc
Data preparation
In this tutorial, we will use sample summary statistics for HDLC and LDLC from Jenger. - Kanai, Masahiro, et al. "Genetic analysis of quantitative traits in the Japanese population links cell types to complex human diseases." Nature genetics 50.3 (2018): 390-400.
The Miami plot for the two traits:

Download sample summary statistics
# HDL-c and LDL-c in Biobank Japan
wget -O BBJ_LDLC.txt.gz http://jenger.riken.jp/61analysisresult_qtl_download/
wget -O BBJ_HDLC.txt.gz http://jenger.riken.jp/47analysisresult_qtl_download/
Download reference files
Precomputed LD-score resources for S-LDSC (standard LD scores, baseline and baseline-LD models, weights, 1000 Genomes Phase 3 plink/frequency files, HapMap3 SNP lists, example sumstats, and GRCh38-related bundles) are distributed on Zenodo as S-LDSC reference files (record 10515792; DOI 10.5281/zenodo.10515792; Steven Gazal; CC BY 4.0). See the record description for the full file list (EUR and EAS), readme_baseline_versions.txt, and the 107 independent GWAS sumstats archive sumstats_indep107.tgz.
For this tutorial (EAS BBJ traits), download and unpack the EAS archives from Zenodo, plus the HapMap3 allele list used by munge_sumstats.py (see note below). EAS genome-wide LD scores for univariate --h2 / --rg and LDSC-SEG Cahoy scores are not in record 10515792; those still come from the Broad requester-pays bucket via gsutil.
# Zenodo: S-LDSC reference files (v4)
ZENODO=https://zenodo.org/records/10515792/files

cd ~/tools/ldsc
mkdir -p resource
cd resource

# EAS weights, plink reference, and baseline LD scores (partitioned heritability)
wget -c "${ZENODO}/1000G_Phase3_EAS_weights_hm3_no_MHC.tgz?download=1"
wget -c "${ZENODO}/1000G_Phase3_EAS_plinkfiles.tgz?download=1"
wget -c "${ZENODO}/1000G_Phase3_EAS_baseline_v1.2_ldscores.tgz?download=1"
tar -xzf 1000G_Phase3_EAS_weights_hm3_no_MHC.tgz
tar -xzf 1000G_Phase3_EAS_plinkfiles.tgz
# Baseline archive unpacks baseline.* files at the top level; keep the layout expected by partitioned LDSC below
mkdir -p 1000G_Phase3_EAS_baseline_v1_2_ldscores
tar -xzf 1000G_Phase3_EAS_baseline_v1.2_ldscores.tgz -C 1000G_Phase3_EAS_baseline_v1_2_ldscores

# Optional on the same record: EAS baselineLD v2.2 (newer baseline-LD annotation set)
# wget -c "${ZENODO}/1000G_Phase3_EAS_baselineLD_v2.2_ldscores.tgz?download=1"
# tar -xzf 1000G_Phase3_EAS_baselineLD_v2.2_ldscores.tgz

# HapMap3 SNP list with reference alleles for --merge-alleles (required by munge_sumstats below).
# Zenodo 10515792 provides hm3_no_MHC.list.txt (rsIDs only); for allele alignment use w_hm3.snplist, e.g.:
wget -c "https://zenodo.org/records/7773502/files/w_hm3.snplist.gz?download=1"
gunzip -f w_hm3.snplist.gz

# EAS LD scores for standard --h2 / --rg (Google Cloud, requester-pays — not on Zenodo 10515792)
gsutil -u <project_name> cp gs://broad-alkesgroup-public-requester-pays/LDSCORE/eas_ldscores.tar.bz2 .
tar -xjf eas_ldscores.tar.bz2

# Cell-type LDSC-SEG scores (Google Cloud, requester-pays)
gsutil -u <project_name> cp gs://broad-alkesgroup-public-requester-pays/LDSCORE/LDSC_SEG_ldscores/Cahoy_EAS_1000Gv3_ldscores.tar.gz .
tar -xzf Cahoy_EAS_1000Gv3_ldscores.tar.gz
EUR analyses can take 1000G_Phase3_ldscores.tgz, 1000G_Phase3_weights_hm3_no_MHC.tgz, 1000G_Phase3_plinkfiles.tgz, and the EUR baseline / baselineLD archives from the same Zenodo record instead of the EAS filenames above.
Munge sumstats
Before the analysis, we need to format and clean the raw sumstats.
Note
Rsid is used here. If the sumstats only contained id like CHR:POS:REF:ALT, annotate it first.
snplist=~/tools/ldsc/resource/w_hm3.snplist
munge_sumstats.py \
    --sumstats BBJ_HDLC.txt.gz \
    --merge-alleles $snplist \
    --a1 ALT \
    --a2 REF \
    --chunksize 500000 \
    --out BBJ_HDLC
munge_sumstats.py \
  --sumstats BBJ_LDLC.txt.gz \
    --a1 ALT \
  --a2 REF \
  --chunksize 500000 \
  --merge-alleles $snplist \
  --out BBJ_LDLC
After munging, you will get two munged and formatted files:
BBJ_HDLC.sumstats.gz
BBJ_LDLC.sumstats.gz
LD score regression
Univariate LD score regression is utilized to estimate heritability and confounding factors (cryptic relatedness and population stratification) of a certain trait.
- Reference : Bulik-Sullivan, Brendan K., et al. "LD Score regression distinguishes confounding from polygenicity in genome-wide association studies." Nature genetics 47.3 (2015): 291-295.
Using the munged sumstats, we can run:
ldsc.py \
  --h2 BBJ_HDLC.sumstats.gz \
  --ref-ld-chr ~/tools/ldsc/resource/eas_ldscores/ \
  --w-ld-chr ~/tools/ldsc/resource/eas_ldscores/ \
  --out BBJ_HDLC

ldsc.py \
  --h2 BBJ_LDLC.sumstats.gz \
  --ref-ld-chr ~/tools/ldsc/resource/eas_ldscores/ \
  --w-ld-chr ~/tools/ldsc/resource/eas_ldscores/ \
  --out BBJ_LDLC
Let's check the results for HDLC:
cat BBJ_HDLC.log
*********************************************************************
* LD Score Regression (LDSC)
* Version 1.0.1
* (C) 2014-2019 Brendan Bulik-Sullivan and Hilary Finucane
* Broad Institute of MIT and Harvard / MIT Department of Mathematics
* GNU General Public License v3
*********************************************************************
Call:
./ldsc.py \
--h2 BBJ_HDLC.sumstats.gz \
--ref-ld-chr /home/he/tools/ldsc/resource/eas_ldscores/ \
--out BBJ_HDLC \
--w-ld-chr /home/he/tools/ldsc/resource/eas_ldscores/

Beginning analysis at Sat Dec 24 20:40:34 2022
Reading summary statistics from BBJ_HDLC.sumstats.gz ...
Read summary statistics for 1020377 SNPs.
Reading reference panel LD Score from /home/he/tools/ldsc/resource/eas_ldscores/[1-22] ... (ldscore_fromlist)
Read reference panel LD Scores for 1208050 SNPs.
Removing partitioned LD Scores with zero variance.
Reading regression weight LD Score from /home/he/tools/ldsc/resource/eas_ldscores/[1-22] ... (ldscore_fromlist)
Read regression weight LD Scores for 1208050 SNPs.
After merging with reference panel LD, 1012040 SNPs remain.
After merging with regression SNP LD, 1012040 SNPs remain.
Using two-step estimator with cutoff at 30.
Total Observed scale h2: 0.1583 (0.0281)
Lambda GC: 1.1523
Mean Chi^2: 1.2843
Intercept: 1.0563 (0.0114)
Ratio: 0.1981 (0.0402)
Analysis finished at Sat Dec 24 20:40:41 2022
Total time elapsed: 6.57s
We can see that from the log:
- Observed scale h2 = 0.1583
- lambda GC = 1.1523
- intercept = 1.0563
- Ratio = 0.1981
According to LDSC documents, Ratio measures the proportion of the inflation in the mean chi^2 that the LD Score regression intercept ascribes to causes other than polygenic heritability. The value of ratio should be close to zero, though in practice values of 10-20% are not uncommon.
Distribution of h2 and intercept across traits in UKB
The Neale Lab estimated SNP heritability using LDSC across more than 4,000 primary GWAS in UKB. You can check the distributions of SNP heritability and intercept estimates using the following link to get the idea of what you can expect from LD score regresion:
https://nealelab.github.io/UKBB_ldsc/viz_h2.html
Cross-trait LD score regression
Cross-trait LD score regression is employed to estimate the genetic correlation between a pair of traits.
Key idea: replace \chi^2 in univariate LD score regression and the relationship (SNPs with high LD ) still holds.
- \(z_ij\) : z score of trait i for SNP j
- \(N_i\) : sample size of trait i
- \(\rho\) : phenotypic correlation
- \(\rho_g\) : genetic covariance
- \(l_j\) : LD score
- \(M\) : number of SNPs
Then we can get the genetic correlation by :
- Reference: Bulik-Sullivan, Brendan, et al. "An atlas of genetic correlations across human diseases and traits." Nature genetics 47.11 (2015): 1236-1241.
ldsc.py \
  --rg BBJ_HDLC.sumstats.gz,BBJ_LDLC.sumstats.gz \
  --ref-ld-chr ~/tools/ldsc/resource/eas_ldscores/ \
  --w-ld-chr ~/tools/ldsc/resource/eas_ldscores/ \
  --out BBJ_HDLC_LDLC
*********************************************************************
* LD Score Regression (LDSC)
* Version 1.0.1
* (C) 2014-2019 Brendan Bulik-Sullivan and Hilary Finucane
* Broad Institute of MIT and Harvard / MIT Department of Mathematics
* GNU General Public License v3
*********************************************************************
Call:
./ldsc.py \
--ref-ld-chr /home/he/tools/ldsc/resource/eas_ldscores/ \
--out BBJ_HDLC_LDLC \
--rg BBJ_HDLC.sumstats.gz,BBJ_LDLC.sumstats.gz \
--w-ld-chr /home/he/tools/ldsc/resource/eas_ldscores/

Beginning analysis at Thu Dec 29 21:02:37 2022
Reading summary statistics from BBJ_HDLC.sumstats.gz ...
Read summary statistics for 1020377 SNPs.
Reading reference panel LD Score from /home/he/tools/ldsc/resource/eas_ldscores/[1-22] ... (ldscore_fromlist)
Read reference panel LD Scores for 1208050 SNPs.
Removing partitioned LD Scores with zero variance.
Reading regression weight LD Score from /home/he/tools/ldsc/resource/eas_ldscores/[1-22] ... (ldscore_fromlist)
Read regression weight LD Scores for 1208050 SNPs.
After merging with reference panel LD, 1012040 SNPs remain.
After merging with regression SNP LD, 1012040 SNPs remain.
Computing rg for phenotype 2/2
Reading summary statistics from BBJ_LDLC.sumstats.gz ...
Read summary statistics for 1217311 SNPs.
After merging with summary statistics, 1012040 SNPs remain.
1012040 SNPs with valid alleles.

Heritability of phenotype 1
---------------------------
Total Observed scale h2: 0.1054 (0.0383)
Lambda GC: 1.1523
Mean Chi^2: 1.2843
Intercept: 1.1234 (0.0607)
Ratio: 0.4342 (0.2134)

Heritability of phenotype 2/2
-----------------------------
Total Observed scale h2: 0.0543 (0.0211)
Lambda GC: 1.0833
Mean Chi^2: 1.1465
Intercept: 1.0583 (0.0335)
Ratio: 0.398 (0.2286)

Genetic Covariance
------------------
Total Observed scale gencov: 0.0121 (0.0106)
Mean z1*z2: -0.001
Intercept: -0.0198 (0.0121)

Genetic Correlation
-------------------
Genetic Correlation: 0.1601 (0.1821)
Z-score: 0.8794
P: 0.3792


Summary of Genetic Correlation Results
p1                    p2      rg      se       z       p  h2_obs  h2_obs_se  h2_int  h2_int_se  gcov_int  gcov_int_se
BBJ_HDLC.sumstats.gz  BBJ_LDLC.sumstats.gz  0.1601  0.1821  0.8794  0.3792  0.0543     0.0211  1.0583     0.0335   -0.0198       0.0121

Analysis finished at Thu Dec 29 21:02:47 2022
Total time elapsed: 10.39s
Partitioned LD regression
Partitioned LD regression is utilized to evaluate the contribution of each functional group to the total SNP heritability.
- \(C\) : functional categories
- \(l(j,C)\) : LD score for SNP j with respect to C.
-
\(\tau_C\) : per-SNP contribution of category C to heritability
-
Reference: Finucane, Hilary K., et al. "Partitioning heritability by functional annotation using genome-wide association summary statistics." Nature genetics 47.11 (2015): 1228-1235.
ldsc.py \
  --h2 BBJ_HDLC.sumstats.gz \
  --overlap-annot \
  --ref-ld-chr ~/tools/ldsc/resource/1000G_Phase3_EAS_baseline_v1_2_ldscores/baseline. \
  --frqfile-chr ~/tools/ldsc/resource/1000G_Phase3_EAS_plinkfiles/1000G.EAS.QC. \
  --w-ld-chr ~/tools/ldsc/resource/1000G_Phase3_EAS_weights_hm3_no_MHC/weights.EAS.hm3_noMHC. \
  --out BBJ_HDLC_baseline
Celltype specificity LD regression
LDSC-SEG : LD score regression applied to specifically expressed genes
An extension of Partitioned LD regression. Categories are defined by tissue or cell-type specific genes.
- Reference: Finucane, Hilary K., et al. "Heritability enrichment of specifically expressed genes identifies disease-relevant tissues and cell types." Nature genetics 50.4 (2018): 621-629.
ldsc.py \
  --h2-cts BBJ_HDLC.sumstats.gz \
  --ref-ld-chr-cts ~/tools/ldsc/resource/Cahoy_EAS_1000Gv3_ldscores/Cahoy.EAS.ldcts \
  --ref-ld-chr ~/tools/ldsc/resource/1000G_Phase3_EAS_baseline_v1_2_ldscores/baseline. \
  --w-ld-chr ~/tools/ldsc/resource/1000G_Phase3_EAS_weights_hm3_no_MHC/weights.EAS.hm3_noMHC. \
  --out BBJ_HDLC_baseline_cts
Sample script
From the 08_LDSC folder (after Install LDSC and downloading reference data):
Run the full pipeline
cd 08_LDSC
conda activate ldsc
./run_ldsc.sh
Numbered helpers: 0_munge.sh, 1_ldsc_h2.sh, 2_ldsc_rg.sh, 3_ldsc_partitioned.sh, 4_ldsc_seg.sh, download_data.sh.
Key terms
LD score regression, LDSC, SNP heritability, genetic correlation, partitioned heritability, LDSC-SEG, summary statistics munging
References
- Gazal, S. S-LDSC reference files (1000 Genomes Phase 3 LD scores, baseline/baseline-LD models, weights, plink/frequency files, HapMap3 lists, example sumstats). Zenodo (2024). https://doi.org/10.5281/zenodo.10515792
- Bulik-Sullivan, Brendan K., et al. "LD Score regression distinguishes confounding from polygenicity in genome-wide association studies." Nature genetics 47.3 (2015): 291-295.
- Bulik-Sullivan, Brendan, et al. "An atlas of genetic correlations across human diseases and traits." Nature genetics 47.11 (2015): 1236-1241.
- Finucane, Hilary K., et al. "Partitioning heritability by functional annotation using genome-wide association summary statistics." Nature genetics 47.11 (2015): 1228-1235.
- Finucane, Hilary K., et al. "Heritability enrichment of specifically expressed genes identifies disease-relevant tissues and cell types." Nature genetics 50.4 (2018): 621-629.
- Kanai, Masahiro, et al. "Genetic analysis of quantitative traits in the Japanese population links cell types to complex human diseases." Nature genetics 50.3 (2018): 390-400.